Production Network Monitoring
sFlow
- Top Sources
- Source Port
- Top Destinations
- Destination Port
- Traffic over time
- Flow by Filter Interface
- Flow by Device & IF
- Count sFlow vs. Last Wk
- Flow QoS PHB
- Flow Source
- Flow Destination
- sFlow MTU Distribution
- Flows by Time
sFlow and VXLAN
The sFlow dashboard shows both outerand inner flows of VXLAN packets based on the VNI number of the VXLAN packet. To see all the inner flows of a particular VXLAN packet, first filter by VXLAN packets on the App L4 Port window to display all of the VXLAN packets. Identify the VXLAN packet you are interested in from the Flows by Time window. Expand the row, and note the VNI number of the packet, then remove the VXLAN filter and filter based on the VNI number. This will show both the outer flow of the VXLAN packet and all the inner flows associated with that VXLAN packet.
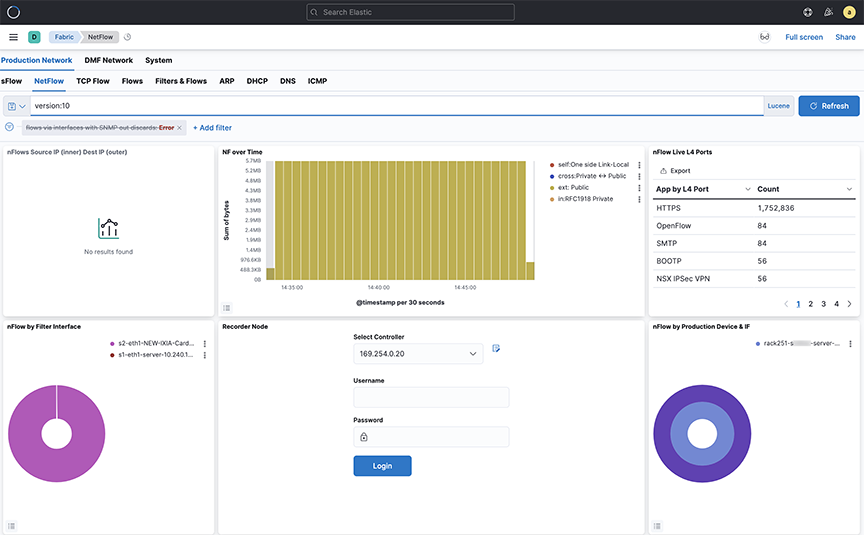
NetFlow and IPFIX
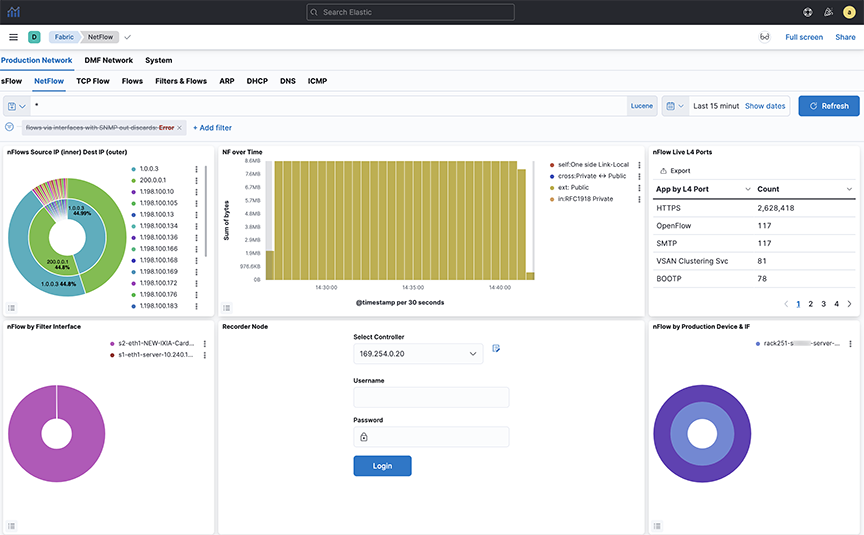
To obtain NetFlow packets, you must configure the NetFlow collector interface on the Arista Analytics Node, as described in the Setting up the NetFlow Collector on the Analytics Node section.
- nFlow Source IP (inner) Destination IP (outer)
- NF over Time
- nFlow Live L4 Ports
- nFlow by Filter Interface
- nFlow by Production Device & IF
- NF by QoS PHB
- NF by DPI App Name
- NF Top Talkers by Flow
- NF Detail
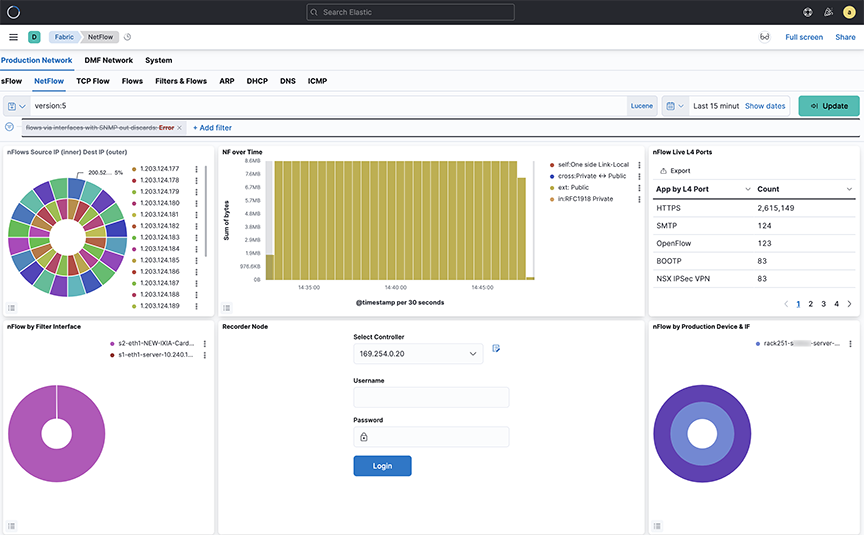
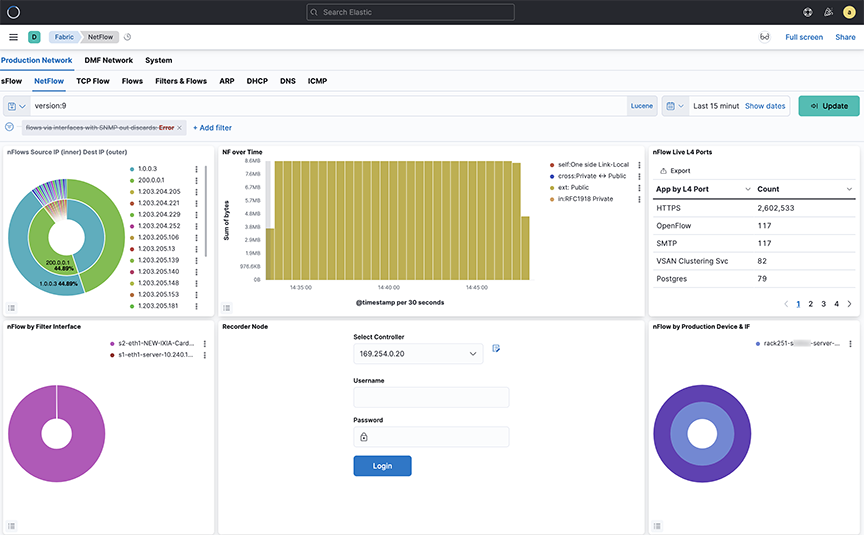
- The Arista Analytics Node cluster listens to NetFlow v9 and IPFIX traffic on UDP port 4739. NetFlow v5 traffic learn on UDP port 2055.
- Refer to DANZ Monitoring Fabric 8.4 User Guide for NetFlow and IPFIX service configuration.
- Starting from the DMF-8.1.0 release, Analytics Node capability augment in support of the following Arista Enterprise-Specific Information Element IDs:
- 1036 -AristaBscanExportReason
- 1038 -AristaBscanTsFlowStart
- 1039 -AristaBscanTsFlowEnd
- 1040 -AristaBscanTsNewLearn
- 1042 -AristaBscanTagControl
- 1043 -AristaBscanFlowGroupId
Consolidating Netflow V9/IPFIX records
The user can consolidate Netflow V9 and IPFIX records by grouping those sharing similar identifying characteristics within a configurable time window.
This reduces the number of documents published in ElasticSearch, reducing disk usage and increasing efficiency, specially for long flows where a 40:1 consolidation has been observed.
In case oflow flow rate for packets, it is recommended to not enable this consolidation. It may result in delay in the publication of documents.
 cluster:analytics# config
analytics(config)# analytics-service netflow-v9-ipfix
analytics(config-controller-service)# load-balancing policy source-hashing
- Source hashing: forwards packets to nodes statistically assigned by a hashtable of their source IP address. It is recommended to use this, since consolidation operations are performed on each node independently.
- Round-robin: distributes the packets equally between the nodes, if source-hashing results in traffic distribution being significantly unbalanced. Round-robin is the default behavior.
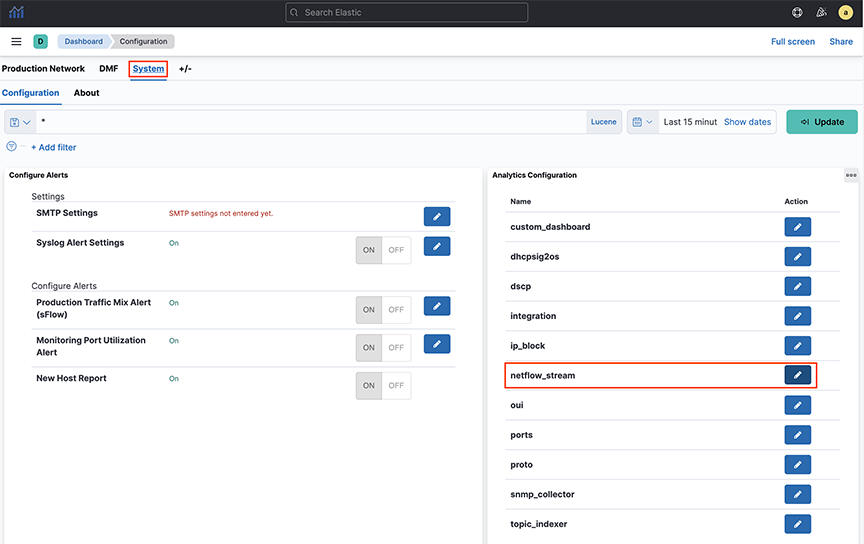
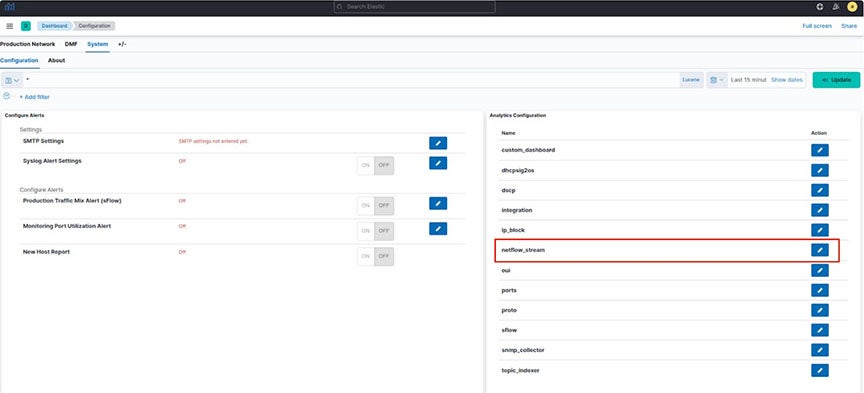
Kibana Setup
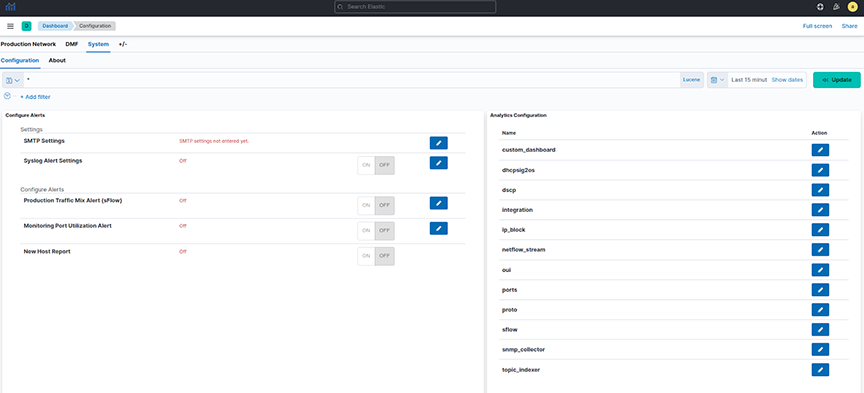
To perform the Kibana configuration, select the tab on the Fabric page and open the panel:
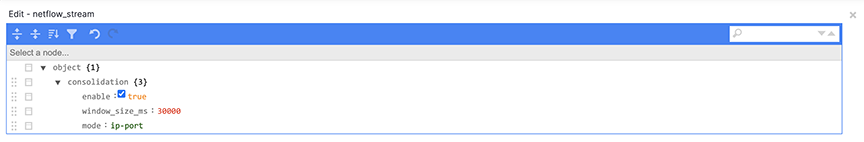
- enable: enables or disables the consolidation.
- window_size_ms: window size is adjusted by the rate of Netflow V9/IPFIX packets per second received by the analytics node. By default, the window is set to 30 seconds, though it is measured in millisecond.
- mode: There are three supported modes:
- ip-port: consolidates records with the same source IP address, destination IP address, IP protocol number, and lower numerical value of source or destination Layer 4 port number.
- dmf-ip-port-switch: consolidates records from common DMF Filter switches that also meet "ip-port" criteria.
- src-dst-mac: consolidates records with the same source and destination MAC address.
Note:Only use this mode with Netflow V9/IPFIX templates collecting Layer 2 fields.
Consolidation Troubleshooting
If consolidation is enabled but does not occur, Arista Networks recommends creating a support bundle and contacting Arista TAC.
Load-balancing Troubleshooting
If there are any issues related to load-balancing, Arista Networks recommends creating a support bundle and contacting Arista TAC.
NetFlow and IPFIX Flow with Application Information
This section describes a new feature of Arista Analytics that combines Netflow and IPFIX records containing application information with Netflow and IPFIX records containing flow information.
This feature improves the visibility of data per application by correlating flow records with applications identified by the flow exporter.
This release supports only applications exported from Arista Networks Service Nodes. In a multi-node cluster, load balancing must be configured in the Analytics Node CLI command.
Configuration
analytics# config
analytics(config)# analytics-service netflow-v9-ipfix
analytics(config-an-service)# load-balancing policy source-hashingKibana Configuration
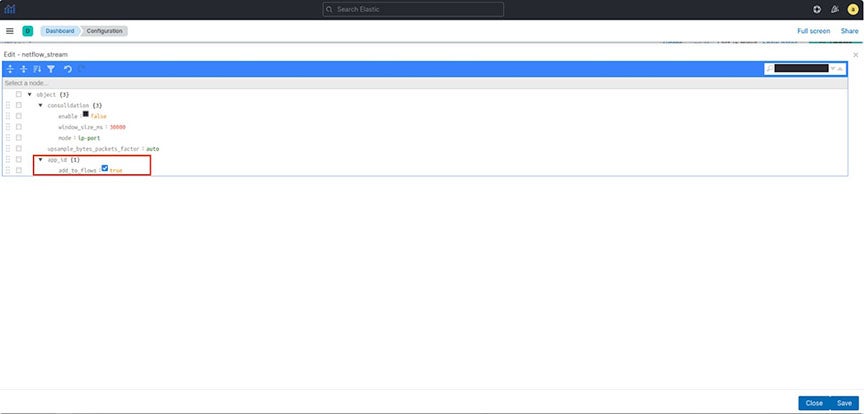
- add_to_flows: Enables or disables the merging feature.
ElasticSearch Documents
Three fields display the application information in the final NetFlow/IPFIX document stored in ElasticSearch:
- appScope: Name of the NetFlow/IPFIX exporter.
- appName: Name of the application. This field is only populated if the exporter is NTOP.
- appID: Unique application identifier assigned by the exporter.
Troubleshooting
If merging is enabled but does not occur, Arista Networks recommends creating a support bundle and contacting Arista TAC.
- Some flow records may not include the expected application information when configuring round-robin load balancing of Netflow/IPFIX traffic. Arista Networks recommends configuring the source-hashing load-balancing policy and sending all Netflow/IPFIX traffic to the Analytics Node from the same source IP address.
- Application information and flow records are correlated only if the application record is received before the flow record.
- Arista Networks only supports collecting application information from Netflow/IPFIX exporters: NTOP, Palo Alto Networks firewalls, and Arista Networks Service Node.
NetFlow and sFlow Traffic Volume Upsampling
This feature of Arista Analytics offers the ability to upsample traffic volume sampled by NetFlow V9/IPFIX and sFlow. This feature provides a better visibility of traffic volumes by approximating the number of bytes and packets from samples collected by the NetFlow V9/IPFIX or sFlow sampling protocols. It provides those approximation statistics along with the ElasticSearch statistics. The feature bases the approximations on the flow exporter’s sampling rate or a user-provided fixed factor.
The DMF 8.5.0 release does not support the automated approximation of total bytes and packets for Netflow V9/IPFIX. If upsampling is needed, Arista Networks recommends configuring a fixed upsampling rate.
NetFlow/IPFIX Configuration
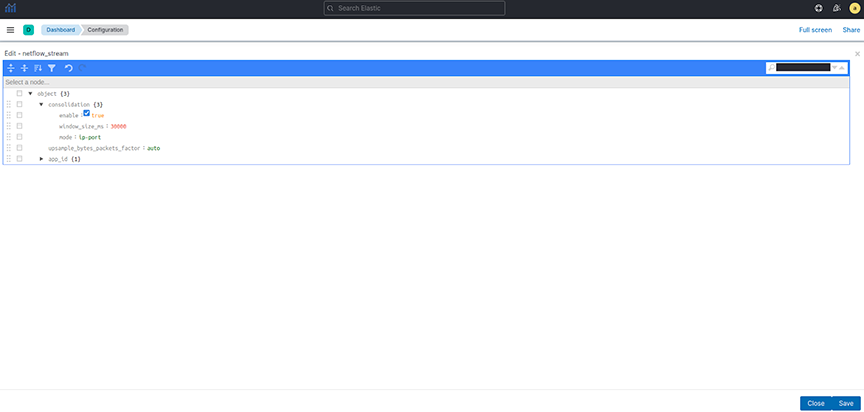
To perform the Kibana configuration, select the tab on the Fabric page and open the visualization.

- Auto: This is the default option. DMF 8.5.0 does not support automated upsampling for Netflow V9/IPFIX. Arista Networks recommends configuring an integer if upsampling is needed.
- Integer: Multiply the number of bytes and packets for each collected sample by this configured number.
sFlow Configuration
To perform the Kibana configuration, select the tab on the Fabric page and open the visualization.

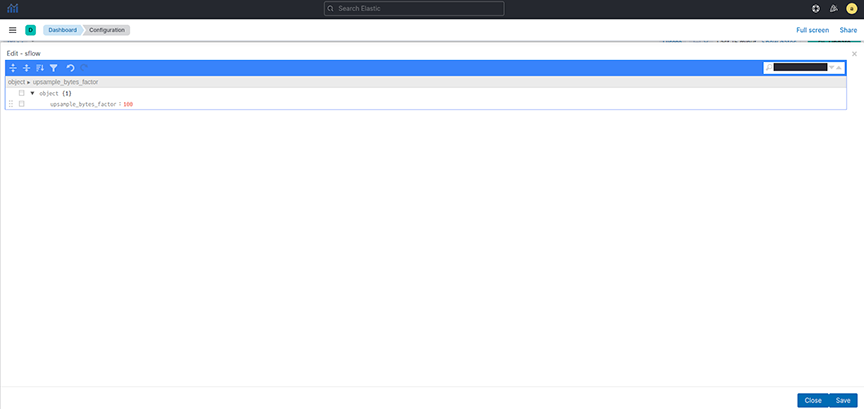
- Auto: Approximate the number of bytes and packets for each collected sample based on the collector’s sampling rate. Auto is the default option.
- Integer: Multiply the number of bytes and packets for each collected sample by this configured number.
Dashboards
- NF over Time
- NF Top Talkers by Flow
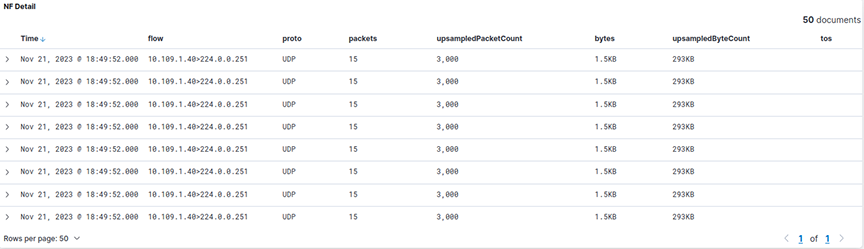
- upsampledPacketCount: Approximate total count of packets for a flow.
- upsampledByteCount: Approximate total count of bytes for a flow.
The SFlow dashboard is on the tab on the Fabric page. The Traffic over Time visualization will display upsampled statistics.
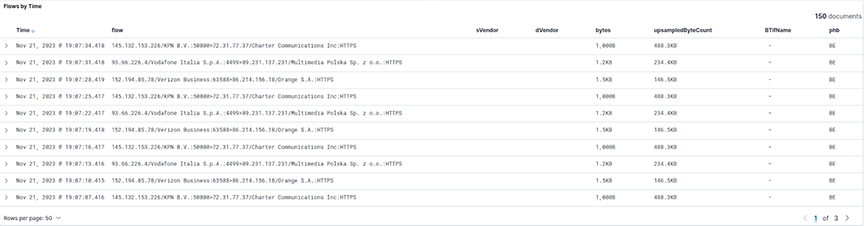
The newly added upsampledByteCount represents a flow's approximate total count of bytes.
Troubleshooting
Arista Networks recommends creating a support bundle and contacting Arista Networks TAC if upsampling isn’t working correctly.
TCPFlow
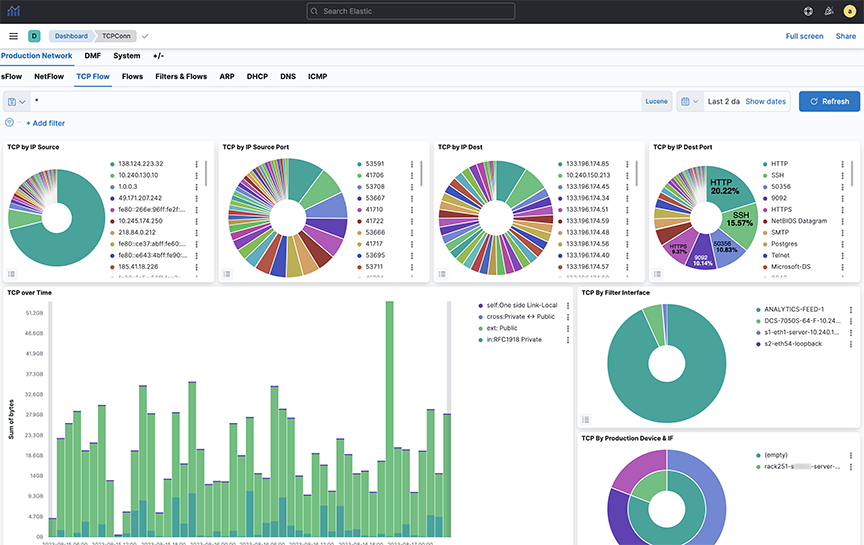
The information on the TCPFlow dashboard depends on TCP handshake signals and deduplicates. The Filter Interface visualization indicates the filter switch port where data is received. The switch description is specified in the Description attribute of each switch, configured on the DANZ Monitoring Fabric controller. Device & IF on this dashboard refers to the end device and depends on LLDP packets received.
Flows
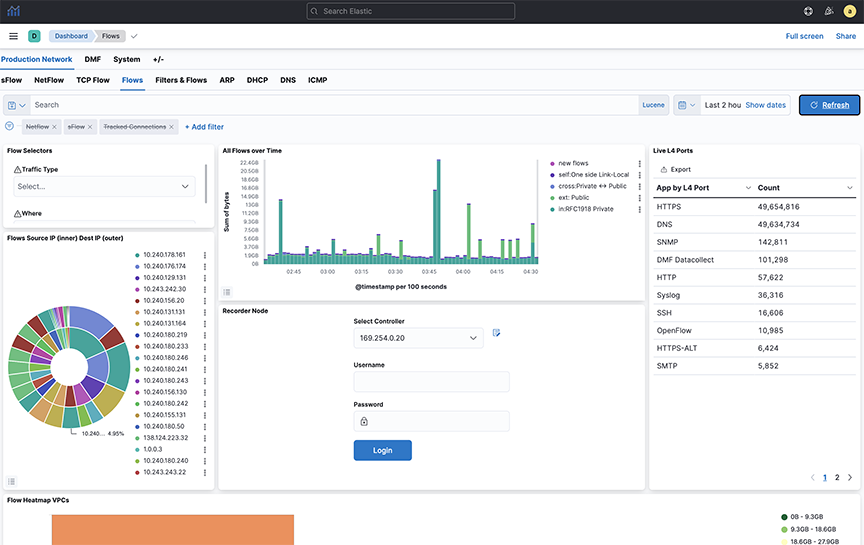
- All Flows Type
- All Flows Overtime
- All Flows Details
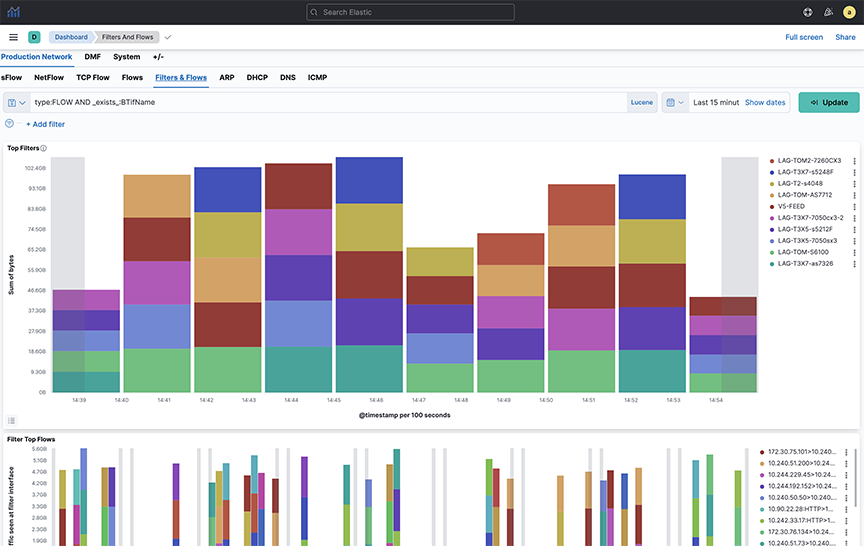
Filters & Flows
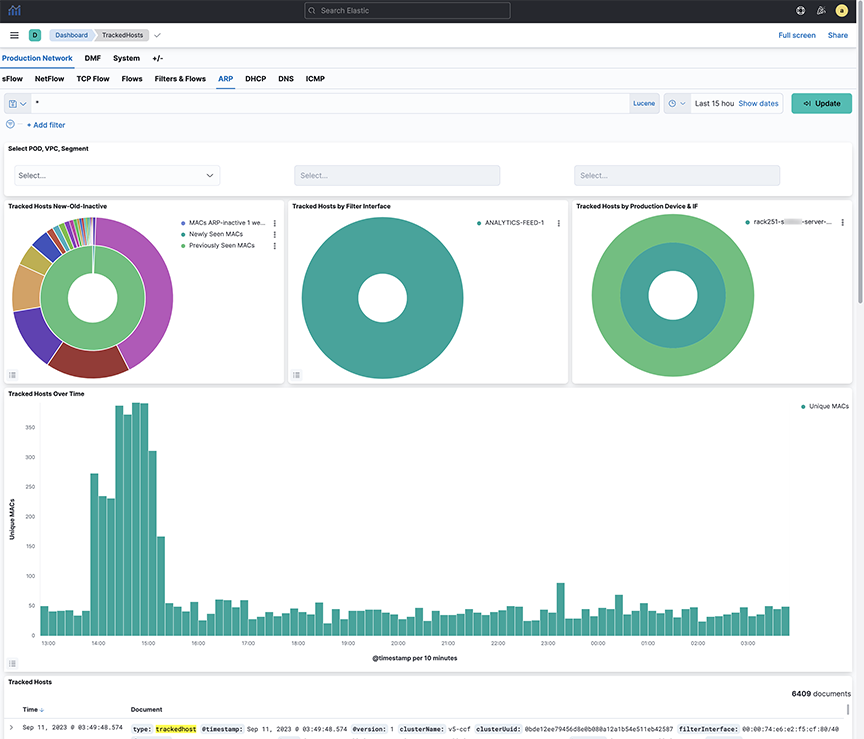
ARP
DHCP
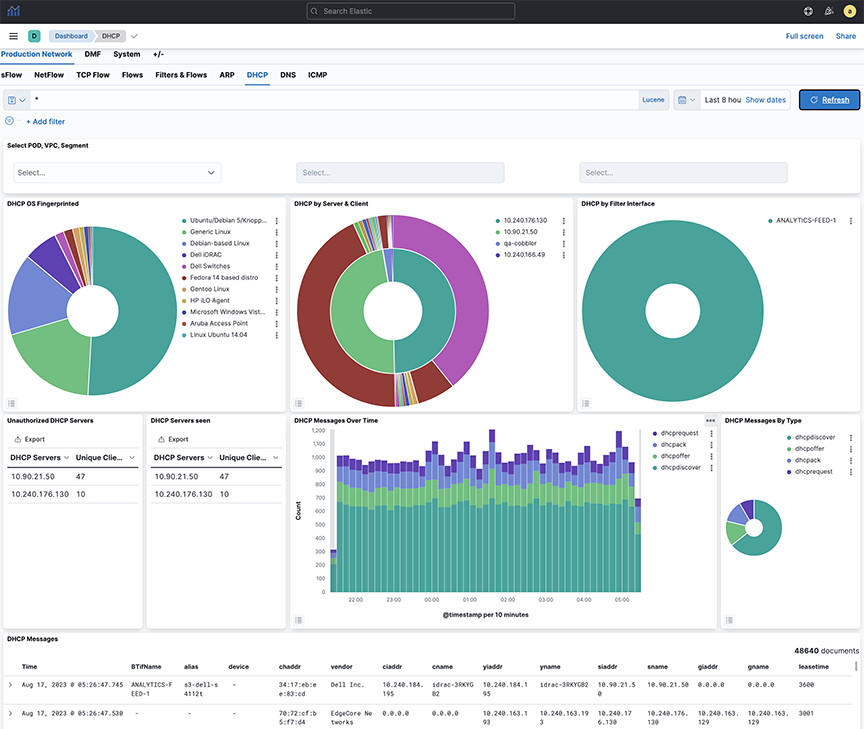
- DHCP OS Fingerprinted
- DHCP Messages by Filter Interface
- DHCP Messages by Production Switch
- Non-whitelist DHCP Servers
- DHCP Messages Over Time
- DHCP Messages by Type
- DHCP Messages
DNS
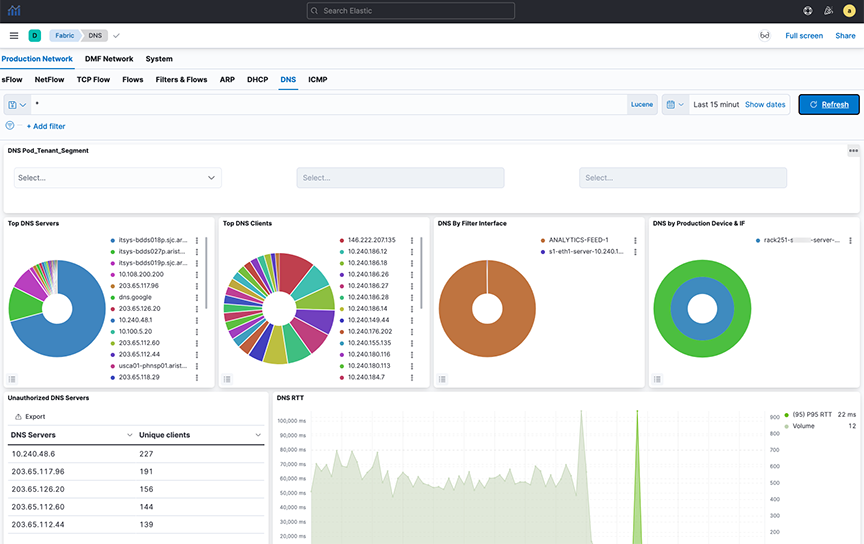
- DNS Top Servers
- DNS Top Clients
- DNS By Filter Interface
- DNS by Production Device & IF
- DNS Messages Over Time
- Unauthorized DNS Servers
- DNS RTT
- DNS All Messages
- DNS RCode Distro
- DNS QType Description
- DNS Top QNames
ICMP
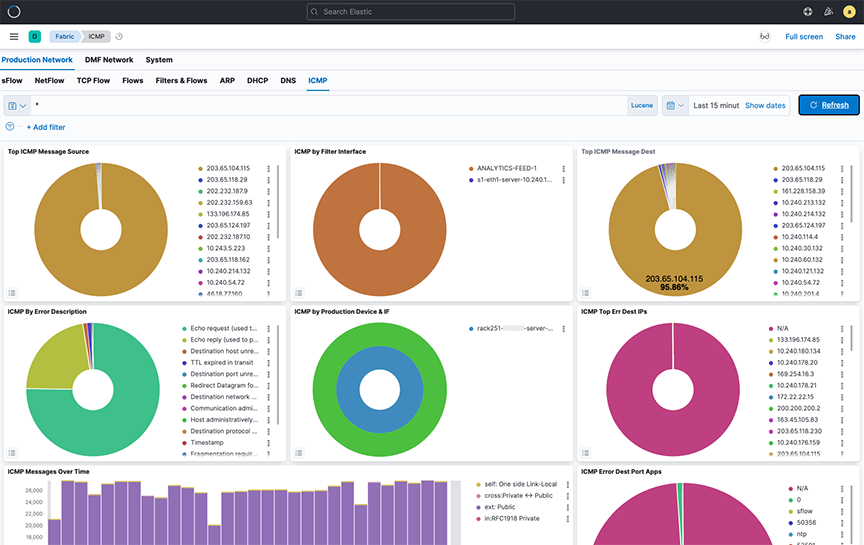
- Top ICMP Message Source
- ICMP by Filter Interface
- Top ICM Message Dest
- ICMP by Error Description
- ICMP by Production Switch
- ICMP Top Err Dest IPs
- ICMP Top Err Dest Port Apps
- ICMP Messages Over Time
- ICMP Table